Application Performance Bottlenecks” width=”400″ height=”300″ src=”/wp-content/uploads/2025/10/netscout-performance-bottlenecks-detection.webp”>
Imagine a situation: a website is slow, a mobile application constantly freezes, and users complain about delays. You, as an ITOps specialist or application owner, are under tremendous pressure trying to quickly find and fix the cause of the problem. Downtime is costly for business, undermines reputation, and leads to customer churn. In such a situation, it is crucial to have effective tools for application performance analysis in your arsenal. NETSCOUT offers a comprehensive solution that allows you to quickly identify and eliminate performance bottlenecks, ensuring the smooth operation of critical services.
Why do Performance Bottlenecks Occur?
Modern IT infrastructures are becoming increasingly complex and distributed. Applications run in hybrid environments, use microservices architecture, and depend on many external services. In such a complex ecosystem, performance bottlenecks can occur anywhere: in the network, on a server, in a database, or even in the application code. Determining the exact cause of the problem can be extremely difficult, especially if you do not have the necessary tools and expertise.
Common causes of performance bottlenecks
- Insufficient network bandwidth
- Server overload
- Slow database queries
- Inefficient application code
- DNS problems
- Resource conflicts
- Unoptimized hardware configuration
NETSCOUT: A Comprehensive Solution for Performance Diagnostics
NETSCOUT provides powerful tools for monitoring and analysis of application performance, which allow you to quickly identify and eliminate performance bottlenecks. The NETSCOUT solution is based on Adaptive Service Intelligence (ASI) technology, which analyzes network traffic in real-time, identifying anomalies and determining the causes of performance problems.
How NETSCOUT Helps Identify Performance Bottlenecks
- End-to-end Performance Monitoring: NETSCOUT provides visibility into the entire application delivery chain, from user to server.
- Automatic Problem Detection: ASI technology automatically detects anomalies and warns of potential problems.
- Deep Traffic Analysis: NETSCOUT allows you to analyze network traffic at the packet level, identifying the causes of delays and errors.
- Integration with Other Tools: NETSCOUT can be integrated with other monitoring and management systems, providing a holistic view of the IT infrastructure.
Solving Specific Problems with NETSCOUT
NETSCOUT allows you to solve a wide range of application performance problems. Let’s look at a few examples:

Finding a Bottleneck in a Three-Tier Application: Server and Network Response Time Analysis
Suppose users complain about the slow operation of a web application consisting of three tiers: a web server, an application server, and a database. With NETSCOUT, you can easily determine which tier is causing the problem. NETSCOUT shows server and network response time analysis for each tier, allowing you to quickly identify performance bottlenecks.
Stages of Application Performance Analysis in a Three-Tier Architecture with NETSCOUT:
- Traffic Monitoring: NETSCOUT collects data on network traffic between all tiers of the application.
- Response Time Analysis: NETSCOUT measures the response time of each tier, identifying delays.
- Identifying the Cause of the Problem: NETSCOUT allows you to delve into the details of the traffic to determine the cause of the delay: server overload, slow database queries, or network problems.
- Troubleshooting: Once the cause of the problem is identified, you can take steps to fix it: optimize the application code, increase server resources, or resolve network problems.
Identifying DNS Problems
DNS problems can cause slow website and application performance. NETSCOUT allows you to identify DNS problems, such as slow name resolution or DNS server unavailability.
Diagnosing Database Problems
Slow database queries are a common cause of performance bottlenecks. NETSCOUT allows you to identify slow queries and analyze their parameters, helping to optimize database performance.
Application Performance Analysis in the Cloud
NETSCOUT also provides monitoring and analysis of application performance running in the cloud. The NETSCOUT solution supports various cloud platforms, such as AWS, Azure, and Google Cloud.
Benefits of Using NETSCOUT for Performance Diagnostics
- Reduced application downtime
- Improved application performance
- Improved user experience
- Reduced IT costs
- Simplified application performance analysis
- Rapid identification and elimination of performance bottlenecks
NETSCOUT offers a comprehensive solution that helps organizations ensure the smooth operation of critical applications and services. With deep traffic analysis, automatic problem detection, and integration with other tools, NETSCOUT allows you to quickly identify and eliminate any performance bottlenecks.
NETSCOUT empowers you not only to react to problems but to anticipate and prevent them, ensuring stable and high performance of your applications. This, in turn, leads to increased business efficiency, improved customer satisfaction, and strengthening your reputation as a reliable service provider.
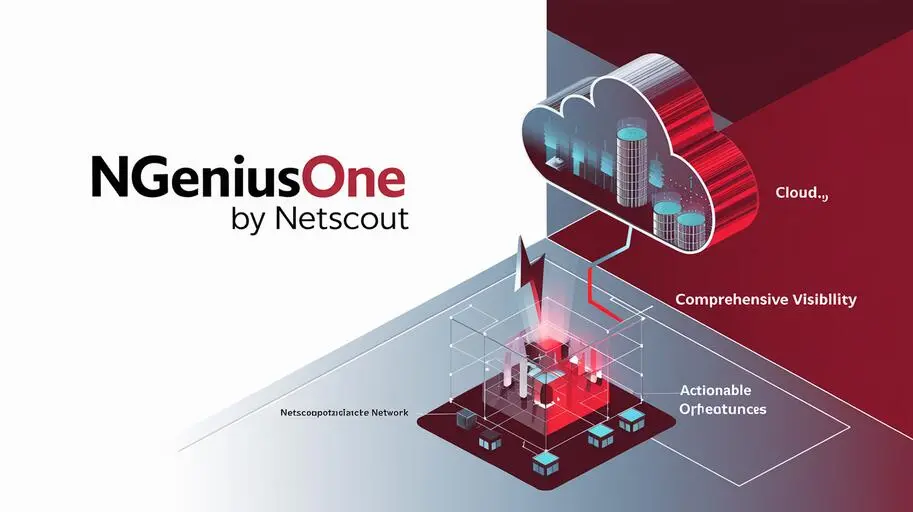
Want to learn more about how NETSCOUT can help you ensure high performance for your applications? Explore the NETSCOUT nGeniusONE product page and see how it can change your monitoring and application performance analysis strategy.
Frequently Asked Questions on: How NETSCOUT Identifies Application Performance Bottlenecks
-
What are application performance bottlenecks?
Application performance bottlenecks are factors that slow down or limit the speed of an application. They can occur in various components of the IT infrastructure, such as the network, servers, databases, or application code.
-
Why is it important to identify performance bottlenecks?
Identifying and eliminating performance bottlenecks is critical because it reduces application downtime, improves application performance, enhances user experience, lowers IT costs, and strengthens the company's reputation.
-
How does NETSCOUT help identify performance bottlenecks?
NETSCOUT uses Adaptive Service Intelligence (ASI) technology, which analyzes network traffic in real-time, identifying anomalies and determining the root causes of performance issues. It provides end-to-end monitoring, automatic problem detection, and deep traffic analysis.
-
What is Adaptive Service Intelligence (ASI)?
Adaptive Service Intelligence (ASI) is a NETSCOUT technology that analyzes network traffic in real-time, automatically identifies anomalies, and determines the root causes of performance issues, enabling quick finding and resolution of bottlenecks.
-
What types of performance issues can NETSCOUT identify?
NETSCOUT can identify a wide range of issues, including insufficient network bandwidth, server overload, slow database queries, inefficient application code, DNS issues, resource conflicts, and unoptimized hardware configuration.
-
Can NETSCOUT help with performance analysis of three-tier applications?
Yes, NETSCOUT makes it easy to identify which tier (web server, application server, or database) is causing the problem in a three-tier application, showing server and network response time analysis for each tier.
-
How does NETSCOUT help in diagnosing DNS issues?
NETSCOUT enables the identification of DNS issues, such as slow name resolution or unavailability of DNS servers, which can lead to slow-running websites and applications.
-
Does NETSCOUT support application monitoring in the cloud?
Yes, NETSCOUT provides monitoring and performance analysis of applications running in the cloud and supports various cloud platforms such as AWS, Azure, and Google Cloud.
-
What are the benefits of using NETSCOUT for performance diagnostics?
Using NETSCOUT reduces application downtime, improves application performance, enhances user experience, lowers IT costs, and simplifies application performance analysis.
-
Where can I learn more about NETSCOUT nGeniusONE?
More detailed information about NETSCOUT nGeniusONE can be found on the product page, where you can see how it can transform your application performance monitoring and analysis strategy.